


2014 Annual Report on Charitable Solicitations in Colorado
SoS home > Charities & fundraisers > 2014 annual report > Table of contents > Trend analysis
18. Trend Analysis
This section provides an overview of the key figures that our office tracks over the years.
The graph below depicts the growth in registered charities in Colorado over the past decade. As of the fiscal year ending June 30, 2014, 11,588 charitable organizations were registered to solicit contributions in Colorado (as of Nov. 30, 2012, the number had grown to 11,945). Growth has averaged approximately 8% over the past two years.
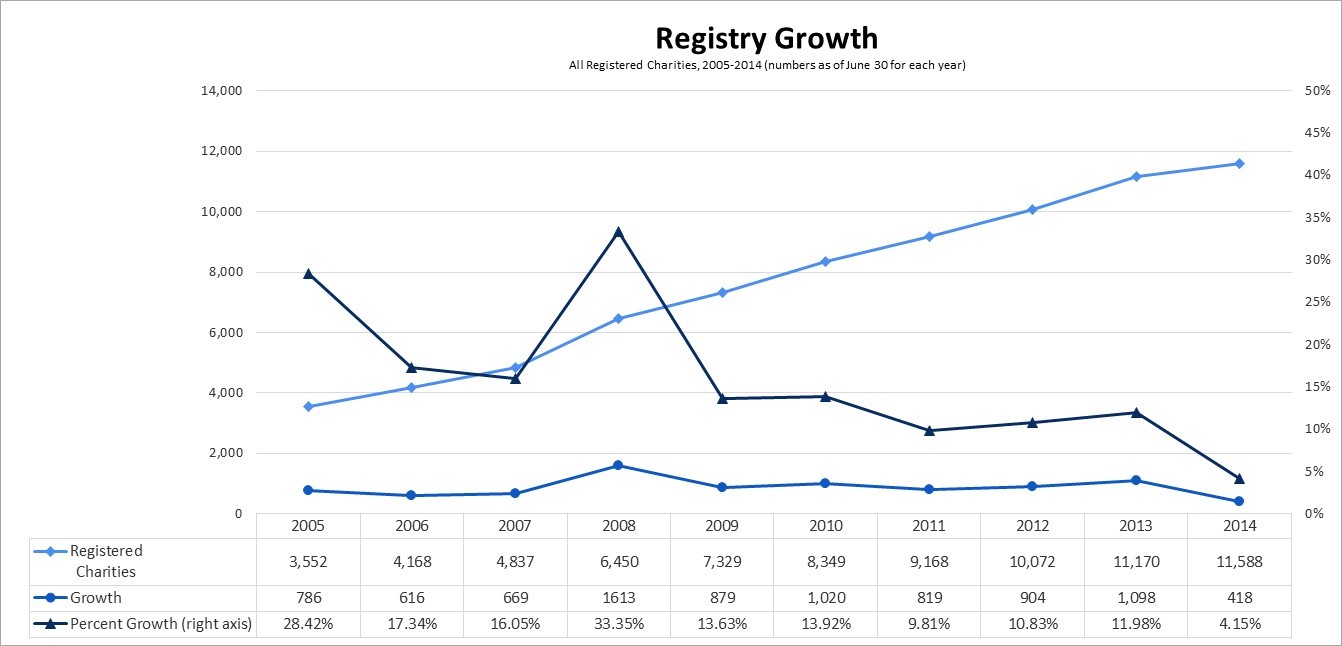
Click on the image to see a full-sized version.
The following graph shows the total number of solicitation campaigns run annually by paid solicitors. Since 2010, when the number of campaigns dipped by 14%, the number of campaigns has increased by an average of 7% per year.
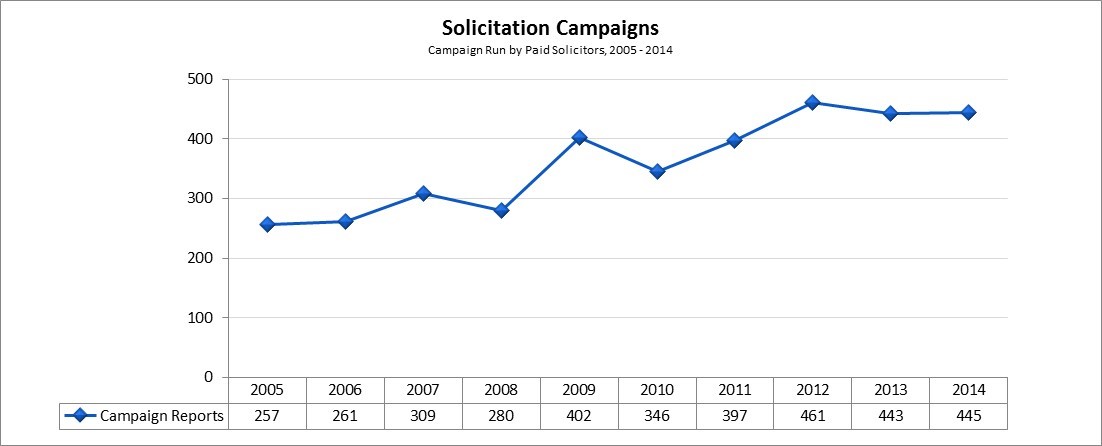
Click on the image to see a full-sized version.
This graph shows the percentage of gross receipts (donations) raised by paid solicitors that makes it to the charity as net revenue, after paying the expenses of the campaign and the paid solicitor’s fee. The percent to charity remained relatively constant between 2013 and 2014, and both years were slightly higher than the ten-year average of 51%.
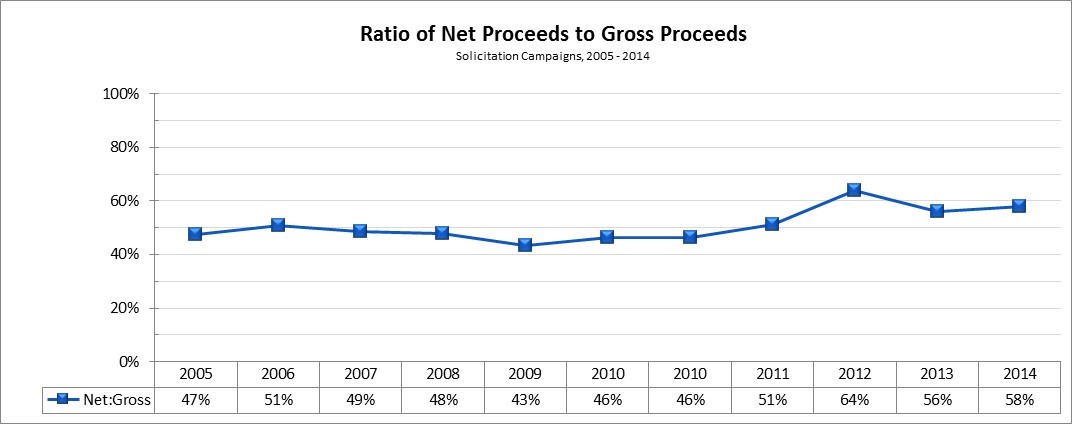
Click on the image to see a full-sized version.
This graph compares the ratio of fundraising expenses to contributions revenue for all registered charities and for registered charities listing a Colorado principal address. The results show that on average charities raise contributions in an effective manner, with Colorado charities spending slightly more on average than all charities combined. This could reflect some economies of scale that charities realize when raising funds on a regional or national basis.
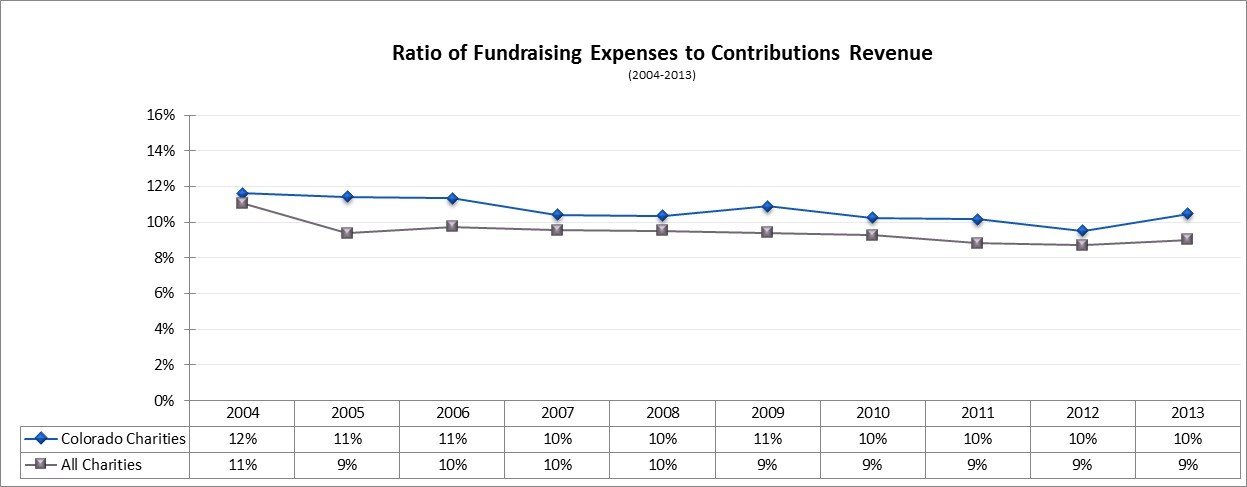
Click on the image to see a full-sized version.
This final chart compares the ratio of program service expenses to total expenses for all charities registered and for all charities listing a Colorado principal address. The results show that on average charities devote a large percentage of their spending to their programs, with Colorado charities spending slightly less on average than all charities combined.
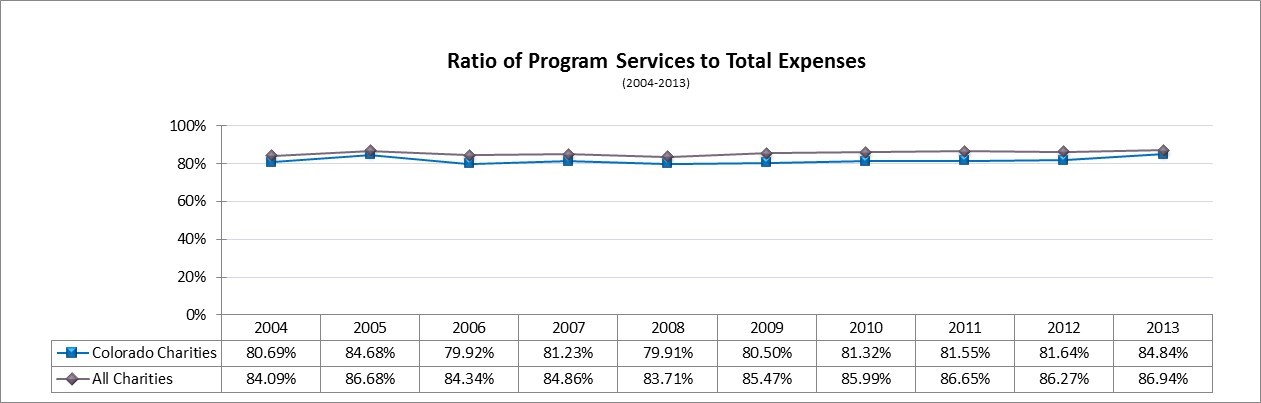
Click on the image to see a full-sized version, or download the program services to total expenses spreadsheet (XLSX).