

 Menu
Menu  Search
 SoS home > Charities & fundraisers > 2012 annual report > Table of contents > Expenses & revenue
17. Expenses and Revenue
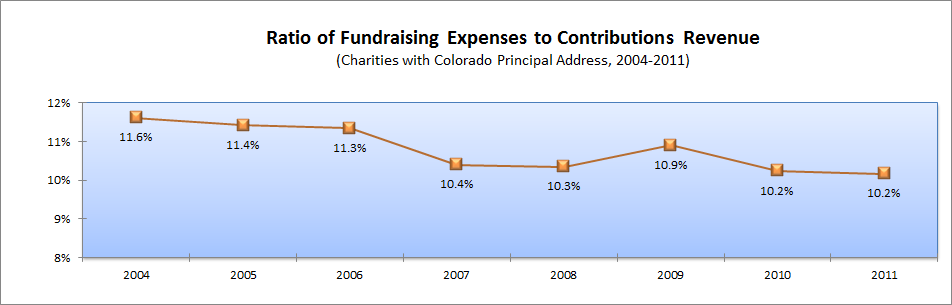
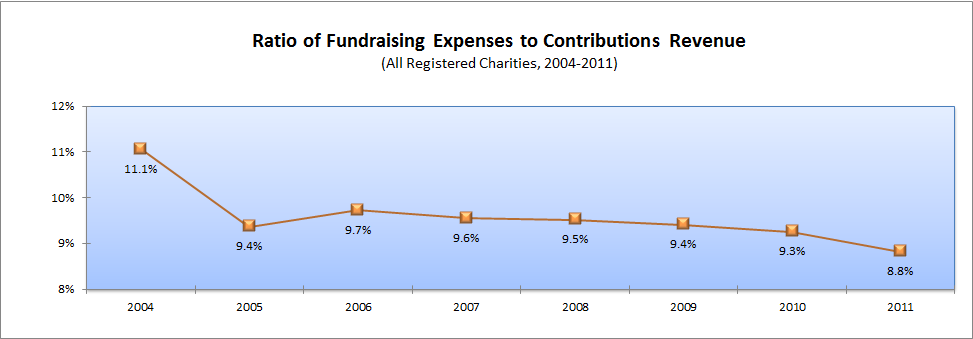
These graphs compare the ratio of fundraising expenses to contributions revenue for all registered charities and for registered charities listing a Colorado principal address. The results show that on average charities raise contributions in an effective manner, with Colorado charities spending slightly more on average than all charities combined. This could reflect some economies of scale that charities realize when raising funds on a regional or national basis.
Ratio of fundraising expenses to contributions revenue
All registered charities 2004 - 2011
Text version of all registered charities 2004 - 2011
Charities with a Colorado principal address 2004 - 2011
Text version of charities with a Colorado principal address 2004 - 2011