


2012 Annual Report on Charitable Solicitations in Colorado
SoS home > Charities & fundraisers > 2012 annual report > Table of contents > Program services & expenses
18. Program Services and Expenses
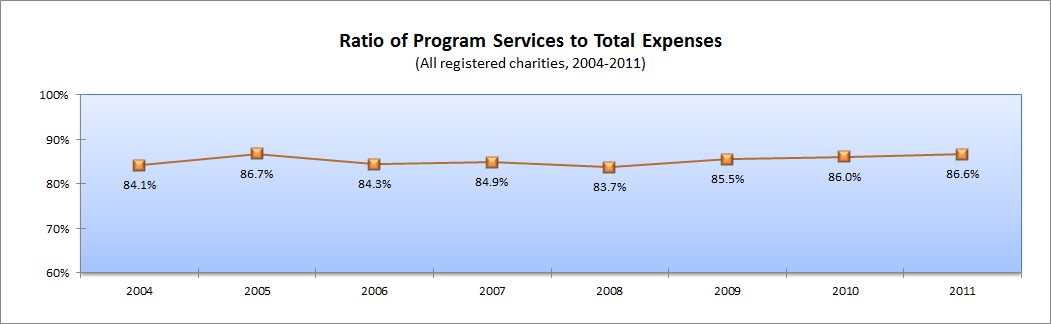
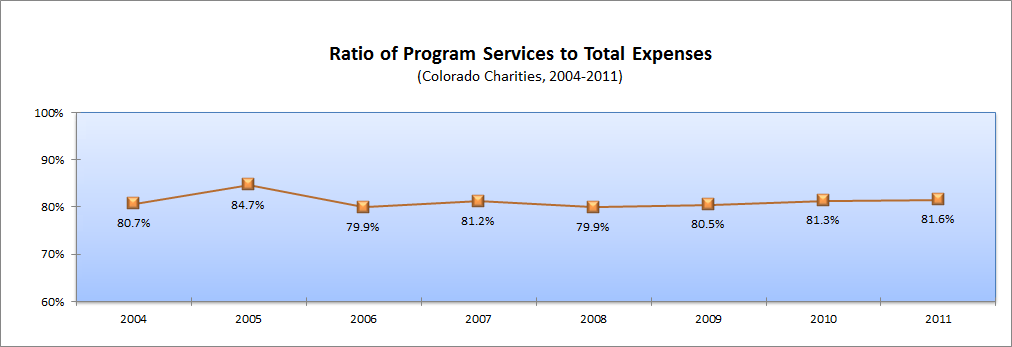
These charts compare the ratio of program service expenses to total expenses for all charities registered and for all charities listing a Colorado principal address. The results show that on average charities devote a large percentage of their spending to their programs, with Colorado charities spending slightly less on average than all charities combined.
Ratio of program services to total expenses
All registered charities 2004 - 2011
Text version of this chart
Click on the image to see a full-size version
Charities with a Colorado principal address 2004 - 2011
Text version of this chart
Click on the image to see a full-size version